Major Vacation Ownership Programs Compared
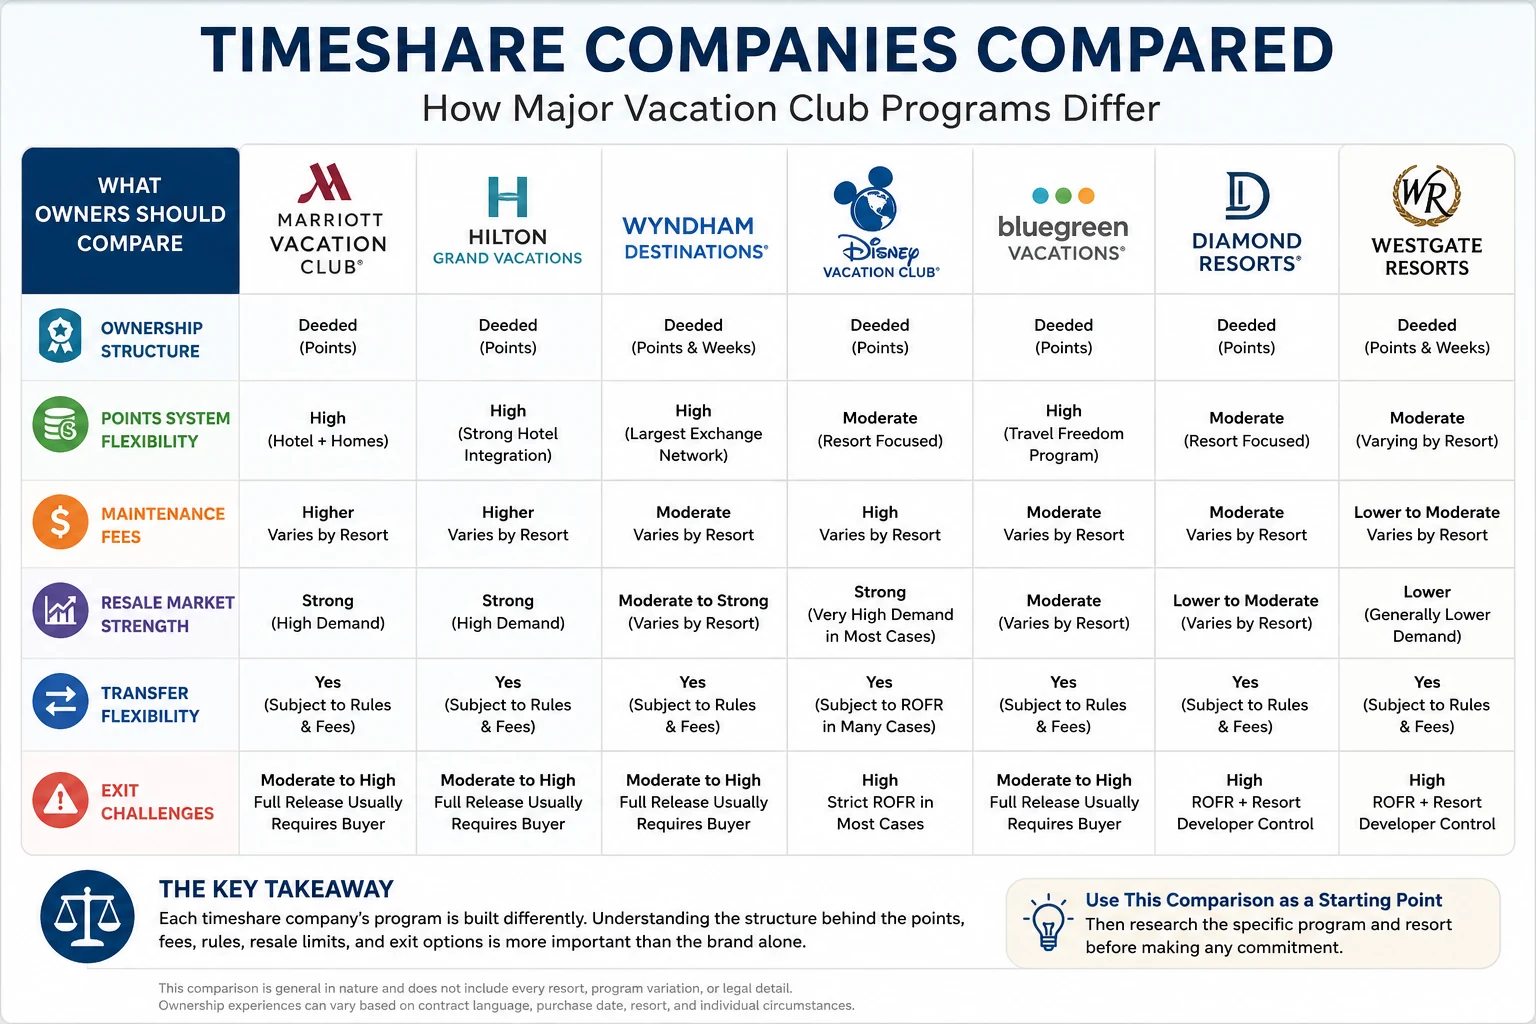
Timeshare Companies Compared: How Major Vacation Club Programs Differ
The resort brand may attract your attention. The ownership system determines what the timeshare may be like to use, pay for, transfer, resell, or eventually exit.
Marriott, Hilton, Wyndham, Disney, Westgate, Holiday Inn Club Vacations, Bluegreen, Hyatt, and other programs can provide appealing vacation experiences while operating under very different rules. Booking access, annual costs, resale rights, inventory competition, and exit pathways can matter long after the sales presentation ends. This guide helps you compare those differences without declaring one company universally better than another.
About this guidance: Timeshare Travel Club Authority’s guidance draws on experience with major timeshare and vacation-club programs, ownership structures, points systems, booking rules, annual fees, exchange options, resale restrictions, transfers, and exit pathways. Program features can vary by developer, resort collection, ownership type, purchase channel, contract, and resale status, so prospective buyers and existing owners should verify the rules and benefits attached to their specific ownership rather than relying only on the parent brand’s reputation.
Comparison Paths
Choose How You Want to Compare Timeshare Companies
Some readers are deciding between two vacation club programs. Others want to research one company or understand how programs compare across specific ownership factors. Start with the path that best matches the decision you are trying to make.
Compare Two Timeshare Companies
Use a direct comparison when you are deciding between two programs and want to review their ownership structures, booking systems, annual costs, resale rules, transfer restrictions, and exit considerations.
View company comparisons → 02 Company ResearchResearch One Timeshare Company
Use the company review directory when you want to research one brand, understand its program structure, review recurring owner concerns, or find a detailed guide for a specific vacation club or developer.
Browse company review guides → 03 Decision FactorsCompare by Ownership Priority
Compare programs by what matters most to you, such as destination access, booking flexibility, annual costs, financing, resale restrictions, transfer rules, or long-term exit flexibility.
Compare the key factors →Important Distinction
Brand Strength and Ownership Structure Are Not the Same Thing
A recognizable timeshare company may offer appealing resorts, familiar service standards, or access to a broader hotel and loyalty ecosystem. Those qualities can shape the vacation experience, but they do not fully explain the long-term ownership obligation.
The ownership structure determines how points or weeks work, how annual fees are calculated, how booking access is managed, and what resale, transfer, surrender, or exit restrictions may apply. Two companies can provide similarly attractive vacations while creating very different costs, usage rules, and long-term flexibility.
A table can show the broad differences, but it still does not tell every reader which company or structure fits best. The more useful question is what kind of ownership situation you are trying to evaluate. Some readers care most about brand ecosystem. Others care about points flexibility, resale strength, or whether the ownership may become difficult to exit later.
Company Comparison
How Major Timeshare Companies Differ
This table provides a high-level comparison of several major vacation ownership programs. It is an orientation tool, not a ranking or review of owner satisfaction. The exact ownership model, benefits, fees, booking rights, resale restrictions, and exit options may vary by resort, contract, purchase date, trust, club, and legacy program.
| Company or Program | Program Type and Common Ownership Model | Common Program Appeal | What Deserves Closer Review |
|---|---|---|---|
| Marriott Vacation Club | Vacation club system that may include points-based access, deeded interests, and legacy ownership structures depending on the program and contract. | Brand familiarity, resort quality, destination access, and connections to a broader hospitality and loyalty ecosystem. | The specific ownership program, points requirements, annual dues, booking competition, financing, resale restrictions, transfer rules, and exit eligibility. |
| Hilton Grand Vacations | Vacation club system that may include points-based club usage, deeded interests, and legacy or acquired program structures. | Recognizable hospitality connection, resort-network access, points flexibility, and participation in a broader vacation club ecosystem. | The exact club or legacy program, annual dues, booking rules, points requirements, resale treatment, transfer limits, and surrender eligibility. |
| Club Wyndham | Points-based vacation club system with ownership and usage rights that may vary by resort, trust, program, and contract. | Broad destination access, a large resort network, and flexibility for owners who understand and regularly use the points system. | Points requirements, home-resort or advance-booking rights, reservation availability, annual fees, resale limitations, transfer rules, and exit options. |
| Disney Vacation Club | Vacation club system using points connected to deeded real estate interests with defined contract expiration dates. | Disney resort access, family-travel appeal, strong brand demand, and an active secondary market for some contracts. | Home resort, contract expiration date, remaining term, annual dues, booking priorities, resale restrictions, and realistic long-term Disney usage. |
| Westgate Resorts | Developer and resort ownership system that may include deeded weeks, floating usage, points, or other resort-specific structures. | Resort-focused vacation access in popular family, entertainment, theme-park, and leisure destinations. | The original purchase structure, financing balance, reservation rules, annual fees, resale demand, transfer restrictions, and written surrender eligibility. |
| Holiday Inn Club Vacations | Vacation club system that may include points-based usage and resort ownership interests depending on the purchase, property, and program. | Family-oriented destinations, recognizable hospitality branding, and flexible vacation options within the club network. | Points usage, booking windows, annual costs, financing, resale restrictions, transfer rules, account standing, and developer-managed exit options. |
| Bluegreen Vacations | Points-based vacation club system with resort and club interests that may vary by contract and ownership structure. | Destination variety, points flexibility, and access to a mix of resort, family, and outdoor-oriented vacation experiences. | Annual fees, points usability, booking demand, home-resort rights, resale limitations, transfer rules, and the exact program attached to the contract. |
| Capital Vacations | Vacation club and resort ownership system that may include points, deeded interests, memberships, and acquired legacy programs. | Access to a varied resort portfolio and vacation options across multiple destinations and affiliated programs. | The specific club or legacy program, annual costs, booking access, financing, resale demand, transfer requirements, and available owner-resolution programs. |
| Hilton Vacation Club and Legacy Diamond Resorts Programs | Legacy vacation club system that may include points, trusts, memberships, and resort-specific ownership structures. | Resort variety, destination access, points-based travel options, and participation in a broader vacation ownership network. | The exact legacy program, annual fees, conversion or affiliation terms, booking rules, resale treatment, transfer requirements, and exit options. |
| Hyatt Vacation Club | Vacation club system that may include points-based usage, deeded interests, and legacy Hyatt Residence Club or Welk program structures. | Resort quality, distinctive destinations, brand familiarity, and program-specific vacation access. | The specific ownership program, home-resort rights, booking priority, annual fees, resale treatment, transfer rules, and exit flexibility. |
| Westin and Sheraton Vacation Clubs | Vacation club systems that may include points, usage rights, and legacy deeded resort interests depending on the program and contract. | Resort quality, recognizable hospitality brands, destination networks, and flexibility within a broader vacation club system. | Home-resort rights, booking priority, annual dues, program rules, resale restrictions, transfer limitations, and available exit pathways. |
Program type and ownership model describe different parts of the same system. A company may operate as a vacation club while offering points, deeded interests, memberships, or multiple legacy ownership structures. Two owners with the same brand may therefore have different costs, booking rights, resale limitations, and exit options.
A company that looks appealing in one category may be weaker in another. For example, a program may offer strong resort access but limited resale value. Another may have an active owner community but strict transfer rules. That is why the next step is to compare the major structural factors, not just the brand names.
Compare by Decision Factor
Compare Timeshare Companies by What Matters Most to You
A company that works well for one owner may be a poor fit for another. Instead of looking for an overall winner, compare how each program performs against the priorities that are most likely to affect your travel experience and long-term ownership.
Destinations and Resort Fit
Review whether the company’s resort network matches where and how you realistically travel—not just the destinations highlighted during the sales presentation.
- Are the resorts located where you expect to vacation repeatedly?
- Does the network fit family, beach, city, theme-park, ski, or outdoor travel?
- Would you still use the program if your travel preferences changed?
Booking Flexibility and Inventory Access
Points flexibility has limited value if the dates, room types, or destinations you want are consistently difficult to reserve.
- How far in advance can owners book?
- Do home-resort or priority windows affect access?
- How many points are required during high-demand periods?
Annual Costs and Fee Growth
The purchase price is only one part of the ownership. Compare maintenance fees, club dues, reservation charges, assessments, and other recurring costs.
- How are annual fees calculated?
- Are club dues separate from resort maintenance fees?
- Could the fees remain affordable if they continue increasing?
Ownership Model and Financing
Determine whether the program involves points, deeded interests, weeks, trusts, memberships, or right-to-use arrangements—and whether the purchase is financed.
- What does the buyer legally own?
- Does the ownership expire or continue indefinitely?
- How much interest and total financing cost may be added?
Resale and Transfer Rules
Some programs allow resale or transfer but remove benefits, restrict eligibility, require approval, or charge additional fees.
- Can the ownership be transferred without developer approval?
- Do resale buyers lose points, status, or booking privileges?
- Is there meaningful buyer demand for the specific ownership?
Exit and Long-Term Flexibility
Review what may happen if the ownership no longer fits your finances, health, travel patterns, or family circumstances.
- Does the company offer a surrender or deed-back program?
- Must the loan and annual fees be current?
- What documentation would prove the ownership has ended?
Why the Same Company Can Include Different Ownership Experiences
A timeshare company may operate several clubs, trusts, resort collections, and legacy ownership programs under the same broader brand.
That means two owners with the same company may not have the same booking rights, annual costs, transfer rules, resale restrictions, or exit options. One owner may hold a deeded week, another may participate in a points-based trust, and another may belong to an acquired or converted legacy program.
Differences may also arise from:
- The resort or home collection attached to the ownership;
- The year and terms of the original purchase;
- Whether the ownership was later converted into another program;
- Whether the interest was purchased directly or through resale;
- Booking priority and home-resort rights;
- Separate club dues, trust fees, or membership charges; and
- Program-specific surrender, transfer, or resale rules.
This is especially important when companies acquire, rebrand, or integrate older vacation clubs. The company name may change while some of the original contract terms and ownership rules remain in place.
A company-level comparison can show the broad differences among programs, but it cannot replace identifying the exact club, trust, resort, or legacy system attached to a particular contract.
System Insight
The Brand Name Does Not Identify the Full Ownership System
- One company may operate several clubs, trusts, collections, and legacy programs with different booking rights, annual costs, and ownership rules.
- An acquisition or rebranding does not necessarily replace the original contract. Older deed, trust, membership, or right-to-use terms may continue to affect the ownership.
- Direct purchasers and resale buyers may not receive the same benefits, even when they own within the same broader vacation club.
- Transfer, surrender, and exit eligibility may be program-specific rather than available uniformly across every ownership carrying the company name.
- The most reliable comparison starts with the exact contract: company, club, trust, resort, ownership model, purchase date, and current account status.
The same issue appears across most major vacation club programs. A company can look flexible in marketing materials, but the actual owner experience depends on how the program rules apply to a specific contract. That is why the next section looks at major companies one by one, without treating any brand name as automatically better or worse.
Side-by-Side Guides
Compare Two Timeshare Companies Side by Side
A direct comparison is most useful when you are deciding between two specific vacation club programs. These guides compare ownership structure, points and booking rules, annual costs, resale treatment, transfer limitations, and long-term exit considerations without declaring one company the overall winner.
Marriott Vacation Club vs. Hilton Grand Vacations
Compare two major hospitality-connected vacation club systems, including program structure, points flexibility, booking access, annual costs, resale treatment, transfer rules, and exit considerations.
- Vacation club and ownership-model differences
- Marriott and Hilton travel-ecosystem connections
- Resale, transfer, fee, and exit considerations
Club Wyndham vs. Marriott Vacation Club
Compare a large points-based vacation club network with a hospitality-connected vacation club system, including booking flexibility, ownership models, fees, resale behavior, and exit considerations.
- Points-network and vacation-club differences
- Destination access and booking structure
- Annual costs, resale restrictions, and exit flexibility
Research One Company
Looking for a Detailed Timeshare Company Review?
Side-by-side comparisons help explain how two programs differ. If you want to research one company more closely, use the Timeshare Company Reviews directory to find detailed guides covering program structure, booking concerns, annual costs, resale behavior, transfer restrictions, owner complaints, and possible exit considerations.
Risk Point
Choosing by Brand Name Alone Can Hide the Ownership Tradeoffs
A familiar hospitality brand, attractive resort, or persuasive sales presentation may create confidence in the vacation experience. But those qualities do not automatically mean the ownership will be affordable, easy to book, transferable, valuable on resale, or practical to exit later.
The greater risk is comparing companies by reputation while overlooking the specific ownership being offered. The club, trust, resort, points package, financing terms, annual obligations, booking rights, resale restrictions, and exit requirements may matter more than the company name itself.
A useful comparison should leave you with specific questions to verify—not simply a preferred brand. Before buying, upgrading, transferring, or accepting a sales offer, review the exact ownership terms behind the company name.
Action Step
Ask These Questions Before Choosing a Timeshare Company
Before buying, upgrading, or choosing between two vacation club programs, compare the exact ownership terms behind each company name. Ask the same questions about both options so brand familiarity does not overshadow the long-term costs and restrictions.
What exact club, trust, resort, or legacy program would I own, and is the interest deeded, points-based, membership-based, or right-to-use?
What is the total purchase cost after financing, interest, closing charges, enrollment fees, and any required program upgrades?
What annual maintenance fees, club dues, assessments, reservation charges, or other recurring costs apply?
How do booking windows, home-resort priority, points requirements, and inventory access affect the trips I am most likely to take?
Can the ownership be resold or transferred, and would a resale buyer lose benefits, status, points access, or booking privileges?
Does the company offer surrender, deed-back, hardship, or owner-assistance options, and what loan, fee, or account-standing requirements apply?
Even after comparing companies, the most important question is still personal: how does your specific ownership behave? Two owners with the same company can face different outcomes depending on purchase date, loan balance, fee status, ownership type, and transfer restrictions.
Free Ownership Review Preview
Which Ownership Factors Matter More Than the Company Name?
A company-level comparison can narrow the field, but your actual risk and flexibility depend on the specific contract. Financing, ownership type, annual fees, booking rights, resale restrictions, account standing, and surrender eligibility can all affect whether a program remains practical over time.
Identify which ownership details may create the greatest long-term pressure.
Review factors that may limit booking, resale, transfer, or surrender options.
See which contract and account details may deserve closer investigation.
Move from a brand-level comparison to a clearer preview of your specific ownership factors.
Try the Free Ownership Risk Profile™Free preview • No exit-company sales pitch • Educational decision support
Is There Really a Best Timeshare Company?
There is no single timeshare company that is best for every owner.
One program may be a better fit because its destinations, booking system, ownership model, or annual costs align with how someone actually travels. The same program may be a poor fit for another owner who values different locations, lower recurring costs, stronger resale demand, or more flexible transfer and exit options.
A recognizable brand can influence resort quality, travel appeal, and owner interest, but it does not automatically create a lower-cost, easier-to-use, or easier-to-exit ownership.
Instead of asking only which company is best, ask:
Which program structure best matches how I travel, what I can afford, and what flexibility I may need later?
❓Frequently Asked Questions
Timeshare company comparisons can be confusing because brand reputation, ownership structure, points systems, annual costs, resale behavior, and exit options often get mixed together. These answers clarify how to compare major vacation club programs without treating one company as the universal winner.
Which timeshare company is the best?
There is no single timeshare company that is best for every owner. A program may be a better fit if its destinations, booking system, ownership model, annual costs, and travel options match how you realistically vacation.
The more useful question is whether the specific ownership is affordable, usable, transferable, and flexible enough to remain practical if your travel or financial needs change.
How should I compare Marriott, Hilton, Wyndham, Westgate, and other timeshare companies?
Compare each program using the same factors: ownership structure, resort network, booking windows, points or week usage, maintenance fees, club dues, financing, resale treatment, transfer rules, and possible surrender or exit options.
Resort quality and brand reputation matter, but they do not explain all of the long-term obligations attached to the contract.
Are points-based timeshare programs better than deeded weeks?
Points-based programs may offer broader destination or date flexibility, but they are not automatically better. Their value depends on booking availability, points requirements, annual dues, reservation rules, and how consistently the owner uses the system.
A deeded week may offer more predictable usage in some situations, while a points system may work better for someone who values variety and understands the program’s booking rules.
Does a well-known timeshare brand mean lower ownership risk?
Not necessarily. A recognizable brand may offer appealing resorts, hospitality familiarity, or stronger owner interest, but the risk still depends on the specific contract.
Financing, annual fees, booking competition, resale restrictions, transfer limitations, account standing, and surrender eligibility can create long-term concerns even within a well-known vacation club.
Can two owners with the same timeshare company have different ownership rights?
Yes. One company may operate several clubs, trusts, resort collections, points programs, and acquired legacy systems. Owners may therefore have different booking windows, annual costs, home-resort rights, resale benefits, transfer requirements, and exit options.
The company name is only the starting point. The exact club, trust, resort, ownership model, purchase date, and contract terms determine what an individual owner actually holds.
Which timeshare companies have the strongest resale value?
Resale demand varies by company, resort, ownership type, points package, season, contract term, and benefits available to resale buyers. Some programs may attract more secondary-market interest than others, but resale value is never guaranteed.
Review current resale listings, completed transactions where available, transfer fees, right-of-first-refusal policies, and whether resale buyers lose important benefits before assuming a particular brand will retain value.
Can a company comparison tell me whether I can exit my timeshare?
No. A company comparison can provide useful brand- and program-level context, but exit options depend on the specific contract, loan balance, fee status, ownership structure, transfer restrictions, and current account standing.
A company may offer a surrender or deed-back program without making every ownership eligible. A brand-level comparison should not be treated as a substitute for reviewing the documents and requirements attached to the individual ownership.
How are timeshare company comparisons different from company reviews?
A comparison examines how two or more programs differ across consistent factors such as ownership structure, fees, booking, resale, transfers, and exit considerations. A company review looks more closely at one brand, including its program structure, recurring owner concerns, and company-specific ownership issues.
For detailed research on one company, use the Timeshare Company Reviews directory.
Bottom Line
There is no single timeshare company that is best for every owner.
Major vacation ownership companies differ in their resort networks, program categories, ownership models, booking systems, annual costs, resale treatment, transfer rules, and possible exit options. Even within the same company, two owners may hold different contracts with different benefits and obligations.
A useful comparison should therefore look beyond the brand name and confirm:
- The exact club, trust, resort, or legacy program involved;
- Whether the ownership uses points, weeks, deeds, memberships, or right-to-use interests;
- How booking access and priority windows work;
- What annual fees, dues, and assessments may apply;
- Whether resale or transfer removes important benefits; and
- What documented options may exist if the ownership later stops fitting.
The goal is not to identify an overall winner. It is to determine whether the specific ownership structure, costs, usage rules, and long-term flexibility align with how the buyer realistically expects to travel.
Before You Choose, Buy, or Upgrade
Compare the Contract Behind the Company Name
A brand-level comparison can help narrow the field, but your actual decision depends on the specific ownership being offered. The Timeshare Decision Intelligence Report™ helps organize the ownership documents, financing, annual costs, booking rights, resale restrictions, transfer rules, verification gaps, and possible decision pathways before you make another costly ownership decision.
Get the Timeshare Decision Intelligence Report™ Customized ownership review • Contract and program analysis • No exit-company sales pitchIndependent educational decision support. This is not legal advice, contract cancellation, an exit service, a resale service, lender negotiation, debt settlement, or a promise that a timeshare can be exited.
Related Guides
If you are comparing companies as part of a broader purchase, ownership, or exit decision, these guides can help you evaluate the surrounding issues:
Ownership Costs and Use
- Timeshare Maintenance Fees: Why They Keep Increasing
Understand how annual fees may affect the long-term affordability of any program. - Can You Rent Out Your Timeshare?
Review whether rental rules and realistic demand could help offset ownership costs. - Why Is It So Hard to Book a Timeshare?
Learn why points, booking windows, inventory, and owner priority can affect availability.
Transfers and Exit Planning
- Timeshare Exit Options Compared
Compare surrender, deed-back, resale, transfer, and other possible exit paths. - How to Get Out of a Timeshare Legally
Learn what documentation shows that an ownership obligation has formally ended. - How Timeshare Exit Companies Work
Understand how third-party exit services may approach communication, fees, and ownership resolution.